Survey Results
3 Demographics of Study Participants
Data were collected from August 2022 to April 2024 to assess moral identity and virtue development among college students. The full college sample included college students at 12 centers for Christian thought (CCT), 3 elite Christian institutions of higher education, and also include non-Center participants from 2 secular universities associated with the study centers. A list of CCTs is included in the Appendix.
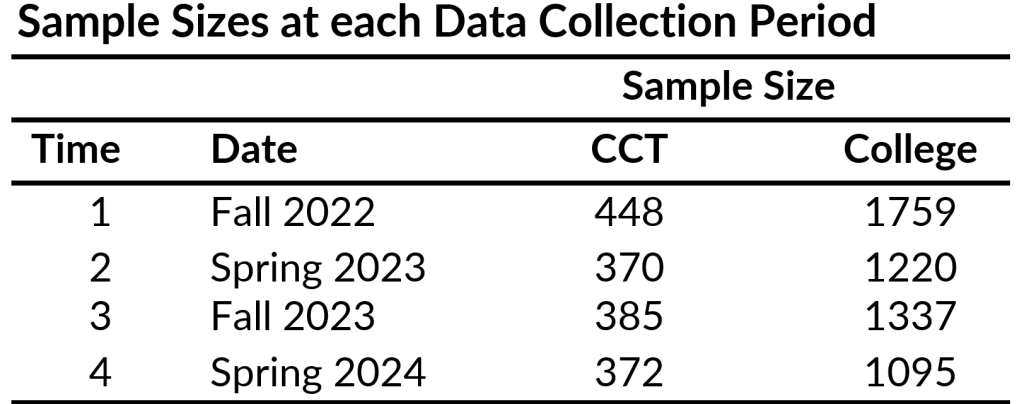
The research team collected data at 4 time points across two academic years (AY22-23, AY23-24). Throughout this report, we will refer to two samples — the CCT and the College samples. Below, we describe who is included in the sample and an overview of the demographics. The table below provides an overview of the sample size for the samples at each time point.

Centers for Christian Thought (CCT) Sample
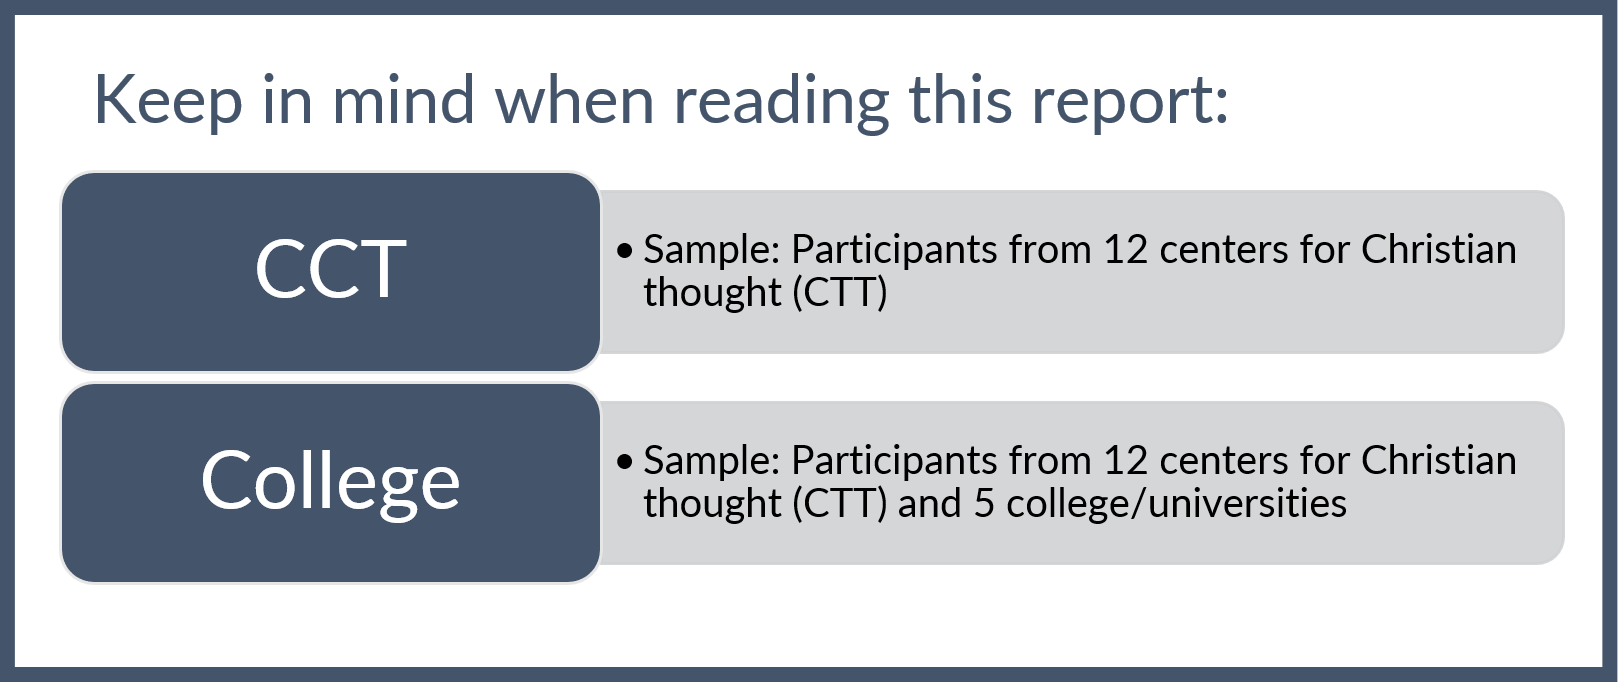
The term “CCT” or “comparator group” will be used to refer to the aggregate data of the twelve CCTs that participated in the study. A list of all CCTs included in this sample is listed in the Appendix. It is unknown whether the CCT score represents the national average of all centers for Christian thought. The CCT score provides a comparative benchmark of how centers from across the U.S. are performing in each domain, which may be useful for comparison. These data provide a snapshot of the current state of centers and are not identified as “the” standard to be achieved.
CCT Demographics
CCT sample participants (n = 638) slightly differed at each wave of data collection; 198 participants responded to all four waves of surveys. On average, across the four waves, the CCT sample can be best described as female (61%); Caucasian (67%); Protestant (60%) or Catholic (31%); and upper-middle class (44%); with a political affiliation ranging from conservative to moderate (65%) and average age of 22. The Appendix provides more detailed descriptions of CCT sample demographics across the four waves.
College Sample
The term general college sample refers to the aggregate data for the entire study. Your center data, CCT data, and data from other colleges/universities are included in the college scores. The college score provides a comparative benchmark of how other college students from across the U.S. are performing in each domain, which may be useful for comparison. These data provide a snapshot of the current state of college students and are not identified as “the” standard to be achieved.
College Demographics
College sample participants (n = 2,791) slightly differed at each wave of data collection; 998 participants responded to all four waves of surveys. On average, across the four waves, the College sample can be best described as female (70%); Caucasian (61%); Protestant (54%) or Catholic (27%); and upper-middle class (41%); with a political affiliation ranging from leaning conservative to moderate (40%); and average age of 21. The Appendix in the CCT final report provides more detailed descriptions of College sample demographics across the four waves.

