Survey Results
5 Religion & Spirituality
This section summarizes the results of the religion and spirituality measures—Christian Orthodoxy, Spirituality, Religious Practices, Religious Motivation, and Attachment to God. For each virtue, we provide an interpretation of low, average, or high. These interpretations are based on cutoff values of the 25th (low), 50th (average), and 75th (high) percentiles of the average virtue scores of students across four timepoints based on the general college sample. For more information about cutoff values, see the Appendix.
Special Note on Interpretations
The terms “low, average, or high” are used to help interpret your score. These terms do not suggest that your overall score is low, average, or high. The terms are simply a system for meaning making, which is done by comparing your scores to other samples (i.e., CCT and College). For example, if we say the CCT sample was low compared to the College sample, then this suggests that 75% of the College sample scored higher than the CCT sample. Whereas, if we say the CCT sample was high compared to the College sample, then this suggests that at least 75% of the College sample scored lower than the CCT average. If we say the CCT sample was average compared to the College sample, then this suggests the CCT score falls within the middle 50% of College scores (i.e., about 25% of scores fall below and about 25% fall above).
Christian Orthodoxy
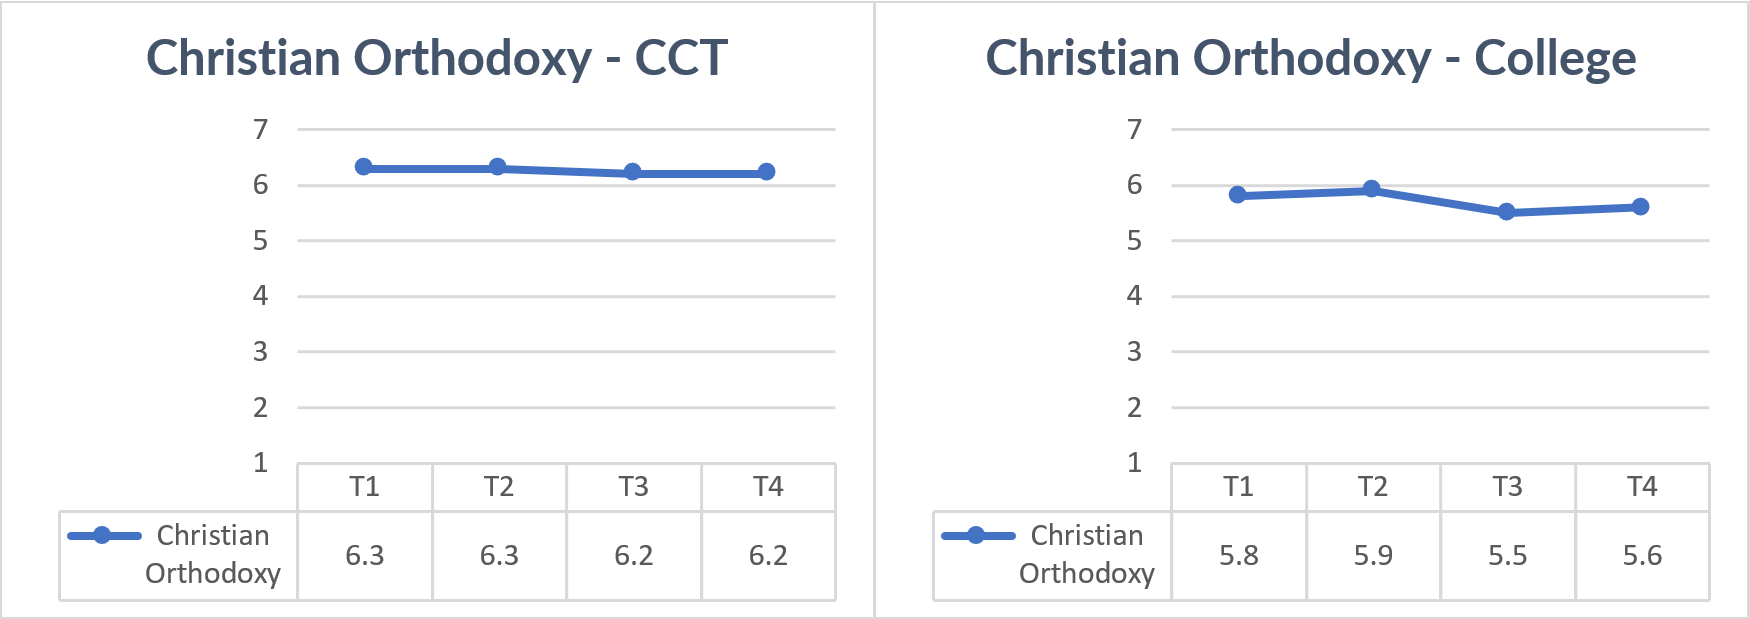
Note: Responses ranged from 1 (strongly disagree) to 7 (strongly agree).
This study measured Christian orthodoxy using a single item from the Christian orthodoxy scale (Hunsberger, 1989). Christian orthodoxy was assessed by the extent to which participants agreed with a basic tenet of the Christian faith: “Through the life, death, and resurrection of Jesus, God provided a way for the forgiveness of people’s sins.” Responses ranged from 1 (strongly disagree) to 7 (strongly agree).
Interpretation: Across the four timepoints, CCT participants’ Christian orthodoxy remained relatively stable. As the figure above demonstrates, the CCT sample means ranged from 6.2 to 6.3; the College sample means ranged from 5.5 to 5.9. The range of means among the different centers and institutes is not demonstrated in the figure. Within the CCT sample, the lowest center/institute mean was 5.1, and the highest center/institute mean was 6.9.[1]
Intrinsic Religiosity
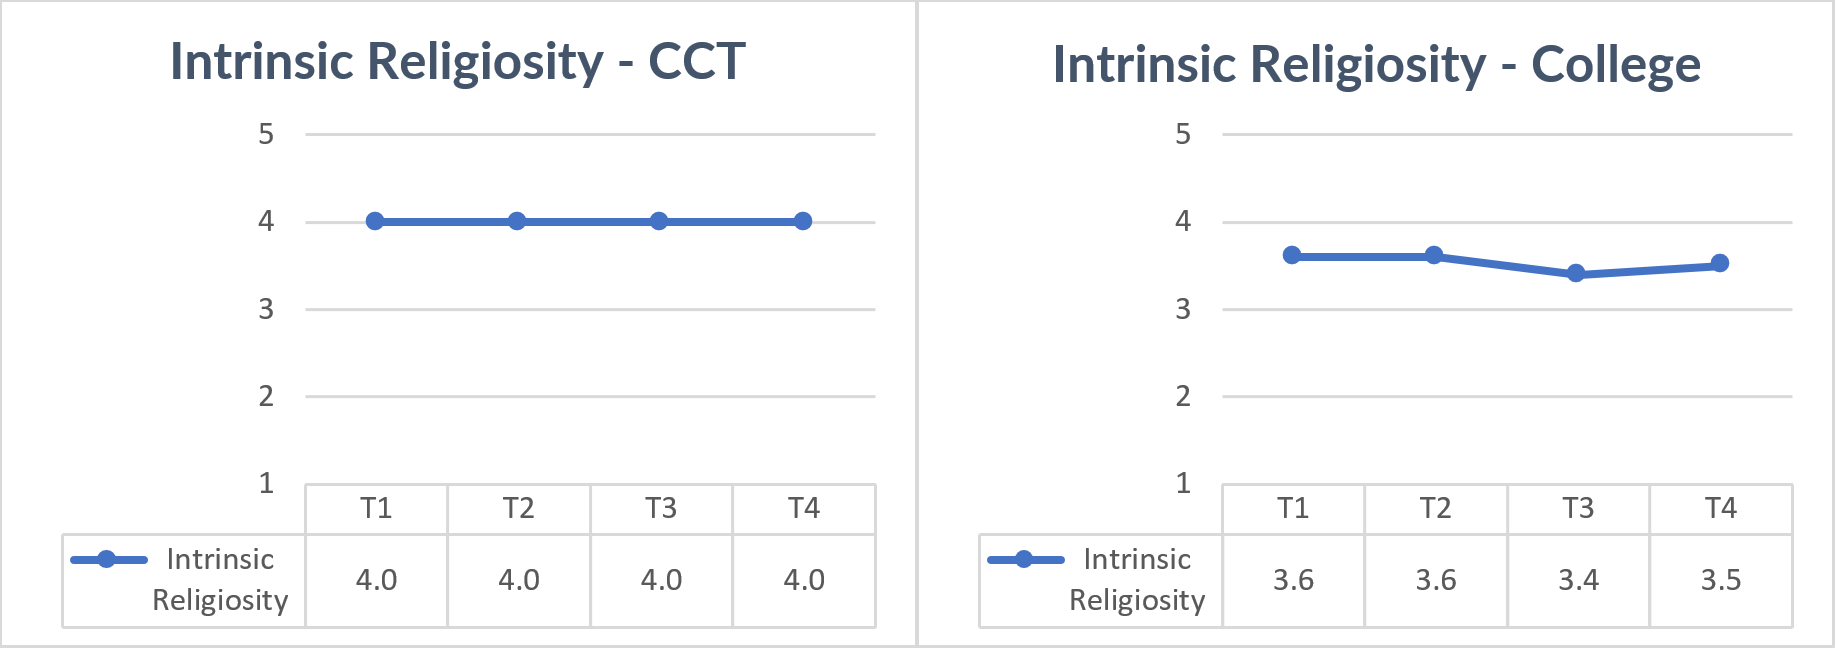
Note. Scale from 1 (definitely not true) to 5 (definitely true).
In this study, intrinsic religiosity is defined as a “personal religious commitment or motivation” by which people practice religion for its own sake (Koenig & Bussing, 2010, p. 80). To assess intrinsic religiosity, participants rated the extent to which they identified with three items from the Duke University Religion Index (Koenig & Bussing, 2010). Responses ranged from 1 (definitely not true) to 5 (definitely true).
Interpretation: Across the four timepoints, the CCT students’ intrinsic religiosity remained stable. As the figure above demonstrates, the CCT sample means remained consistently stable at 4.0; the College sample means ranged from 3.4 to 3.6. The range of means among the different centers and institutes is not demonstrated in the figure. Within the CCT sample, the lowest center/institute mean was 3.4, and the highest center/institute mean was 4.5. Overall, for intrinsic religiosity, these findings suggest that the CCT sample (n = 574) is considered average at all timepoints compared to the general College sample (n = 2,484).
Spirituality
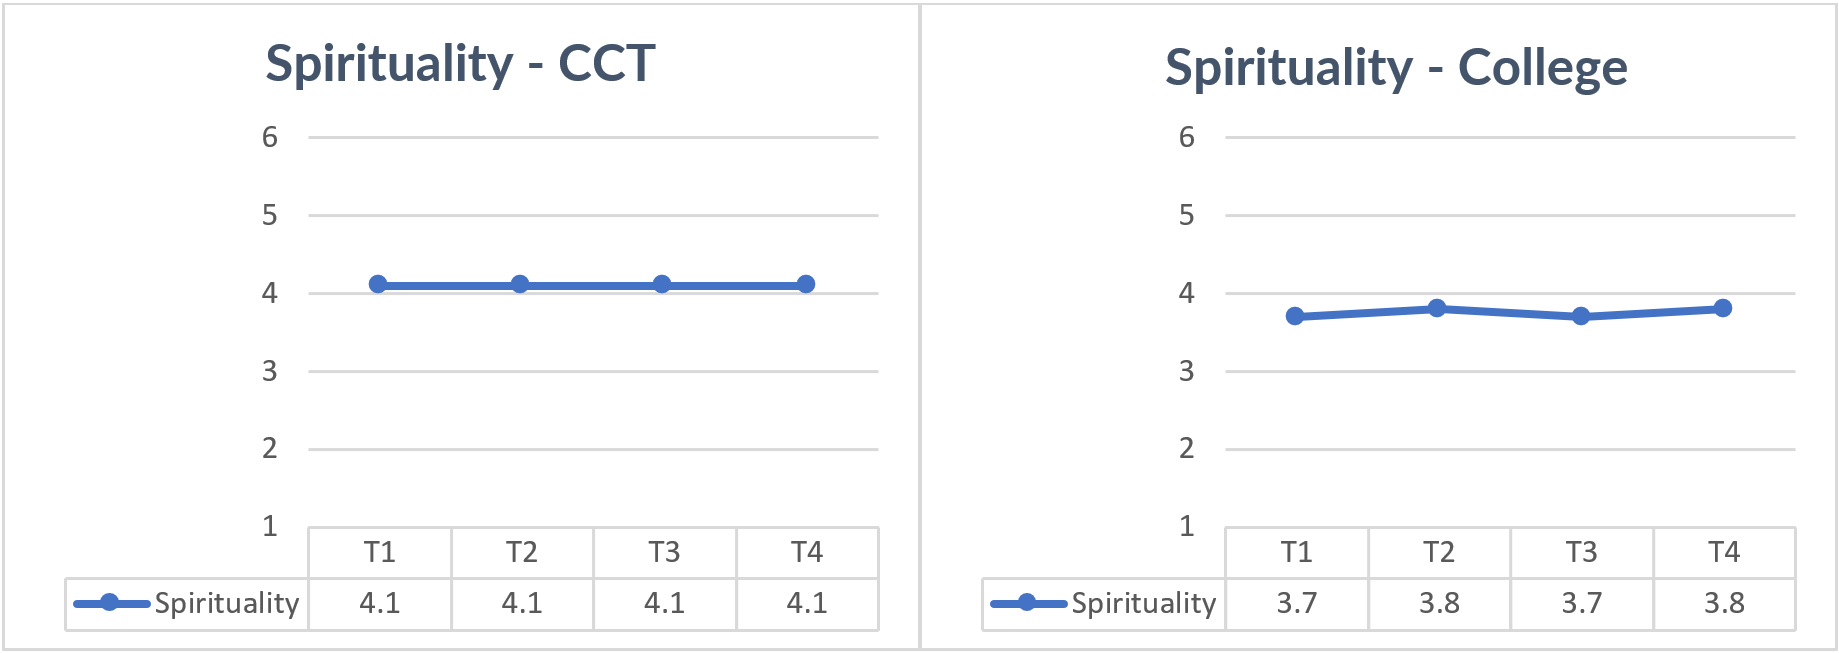
Note. Scale from 1 (never or almost never) to 6 (many times a day).
This study defines spirituality as “a person’s perception of the transcendent (God, the divine) in daily life” (Underwood & Teresi, 2002, p. 23). Spirituality was assessed using the Daily Spiritual Experience Scale (Underwood & Teresi, 2002), which prompts participants to rate how frequently they have spiritual experiences like “[finding] strength and comfort in my religion or spirituality.” Responses ranged from 1 (never or almost never) to 6 (many times a day).
Interpretation: Across the four timepoints, the CCT students’ spirituality remained stable. As the figure above demonstrates, the CCT sample means remained stable at 4.1; the College sample means ranged from 3.7 to 3.8. The range of means among the different centers and institutes is not demonstrated in the figure. Within the CCT sample, the lowest center/institute mean was 3.5, and the highest center/institute mean was 4.7. Overall, for spirituality, these findings suggest that the CCT sample (n = 574) is considered average at all timepoints compared to the general College sample (n = 2,483).
Religious Practices

Note. Scale from 1 (never) to 9 (daily).
This study assessed participant engagement in four religious practices: religious service attendance, parachurch activities, Bible reading, and prayer. Exact item wording came from the Baylor Religion Survey Wave V (Baylor University, 2017), the General Social Survey (Davern et al., 2021), and Glanzer et al.’s (2013) survey of Christian colleges and universities. Response options ranged from 1 (never) to 9 (daily).
Church Attendance was measured using the item, “How often do you attend religious services at a church, mosque, synagogue, or other place of worship.”
Interpretation: Across the four timepoints, the CCT students’ church attendance remained relatively stable. As the figure above demonstrates, CCT sample means ranged from 6.2 to 6.4; the College sample means ranged from 5.3 to 5.7. The range of means among the different centers and institutes is not demonstrated in the figure. Within the CCT sample, the lowest center/institute mean was 5.5, and the highest center/institute mean was 7.0. Overall, for church attendance, these findings suggest that the CCT sample (n = 574) is considered average at all timepoints compared to the general College sample (n = 2,484).
Parachurch Activities include worship meetings, Bible studies, activities with a parachurch organization, or other organized, non-church events. Parachurch engagement was measured using the item, “How often do you attend worship meetings, Bible studies, or other activities with a parachurch organization, like Young Life, Fellowship of Christian Athletes, etc.?”
Interpretation: Across the four timepoints, the CCT students’ parachurch activity involvement decreased. As the figure above demonstrates, the CCT sample means ranged from 5.3 to 5.7; the College sample means ranged from 4.0 to 4.5. The range of means among the different centers and institutes is not demonstrated in the figure. Within the CCT sample, the lowest center/institute mean was 3.1, and the highest center/institute mean was 7.6. Overall, for parachurch activities, these findings suggest that the CCT sample (n = 574) is considered average at all timepoints compared to the general College sample (n = 2,484).
Bible Reading was measured using the question, “How often do you read the Bible?”
Interpretation: Across the four timepoints, the CCT students’ Bible reading remained relatively stable. As the figure above demonstrates, the CCT sample means ranged from 6.7 to 6.8; the College sample means ranged from 5.0 to 5.5. The range of means among the different centers and institutes is not demonstrated in the figure. Within the CCT sample, the lowest center/institute mean was 5.1, and the highest center/institute mean was 8.3. Overall, for Bible Reading, these findings suggest that the CCT sample (n = 574) is considered average at all timepoints compared to the general College sample (n = 2,484).
Prayer was measured using the question, “How often do you pray or meditate?”
Interpretation: Across the four timepoints, the CCT students’ prayer frequency remained relatively stable. As the figure above demonstrates, the CCT sample means ranged from 7.6 to 7.8; the College sample means ranged from 6.7 to 7.1. The range of means among the different centers and institutes is not demonstrated in the figure. Within the CCT sample, the lowest center/institute mean was 6.7, and the highest center/institute mean was 8.7. Overall, for prayer, these findings suggest that the CCT sample (n = 574) is considered average at all timepoints compared to the general College sample (n = 2,484).
Religious Motivation
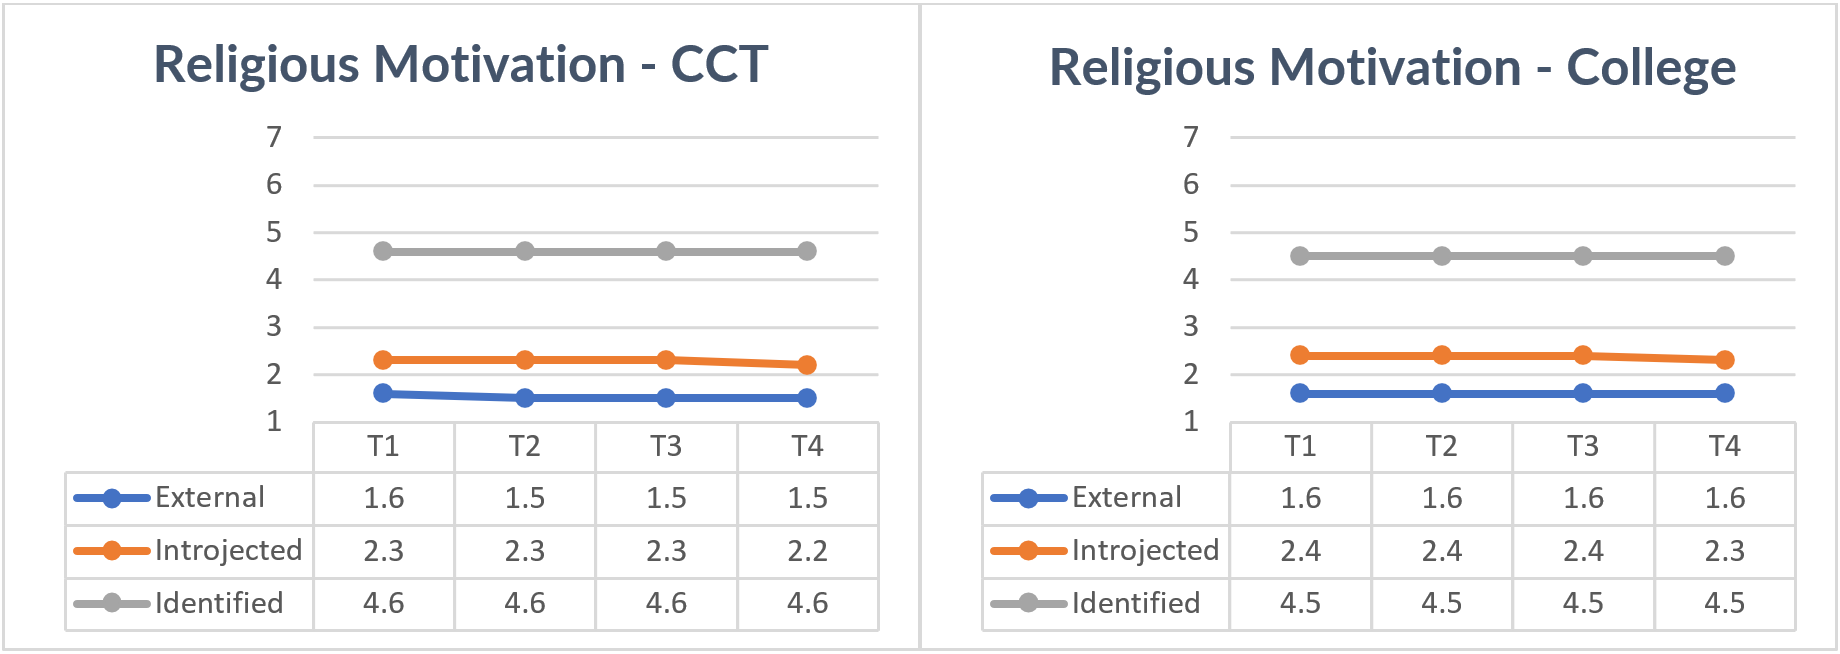
Note. Scale from 1 (strongly disagree) to 7 (strongly agree).
In the present study, religious motivation describes the reasons for which participants engage in religious activities. Religious motivation was measured using three subscales from the 12-item Religious Internalization Scale – Short (Hardy et al., 2022). The three subscales were External Motivation, Introjected Motivation, and Identified Motivation. Response options include 1 (strongly disagree) to 7 (strongly agree).
External Motivation entails engaging in a religious activity “to obtain an outcome that is separable from the activity itself” (e.g., “because people will criticize me if I don’t do it”; Neyrinck et al., 2006, p. 324).
Interpretation: Across the four timepoints, the CCT students’ external religious motivation remained relatively stable. As the figure above demonstrates, the CCT sample means ranged from 1.5 to 1.6; the College sample means remained stable at 1.6. The range of means among the different centers and institutes is not demonstrated in the figure. Within the CCT sample, the lowest center/institute mean was 1.3, and the highest center/institute mean was 1.8. Overall, for external motivation, these findings suggest that the CCT sample (n = 506) is considered average at all timepoints compared to the general College sample (n = 1,796).
Introjected Motivation entails engaging in a religious activity to avoid “threatening internal compulsions, such as feelings of shame, guilt, or self-esteem contingencies” (e.g., “because if I don’t do it I will feel like a failure”; Neyrinck et al., 2006, p. 324).
Interpretation: Across the four timepoints, the CCT students’ introjected religious motivation remained relatively stable. As the figure above demonstrates, the CCT sample means ranged from 2.2 to 2.3; the College sample means ranged from 2.3 to 2.4. The range of means among the different centers and institutes is not demonstrated in the figure. Within the CCT sample, the lowest center/institute mean was 1.9, and the highest center/institute mean was 2.8. Overall, for introjected motivation, these findings suggest that the CCT sample (n = 506) is considered average at all timepoints compared to the general College sample (n = 1,796).
Identified Motivation entails engaging in a religious activity for its own sake because it is inherently satisfying or enjoyable (e.g., “because it is meaningful to me”; Neyrinck et al., 2006).
Interpretation: Across the four timepoints, the CCT students’ intrinsic religious motivation remained stable. As the figure above demonstrates, the CCT sample means remained stable at 4.6; the College sample means remained stable at 4.5. The range of means among the different centers and institutes is not demonstrated in the figure. Within the CCT sample, the lowest center/institute mean was 4.2, and the highest center/institute mean was 4.7. Overall, for identified motivation, these findings suggest that the CCT sample (n = 506) is considered average at all timepoints compared to the general College sample (n = 1,796).
Attachment to God
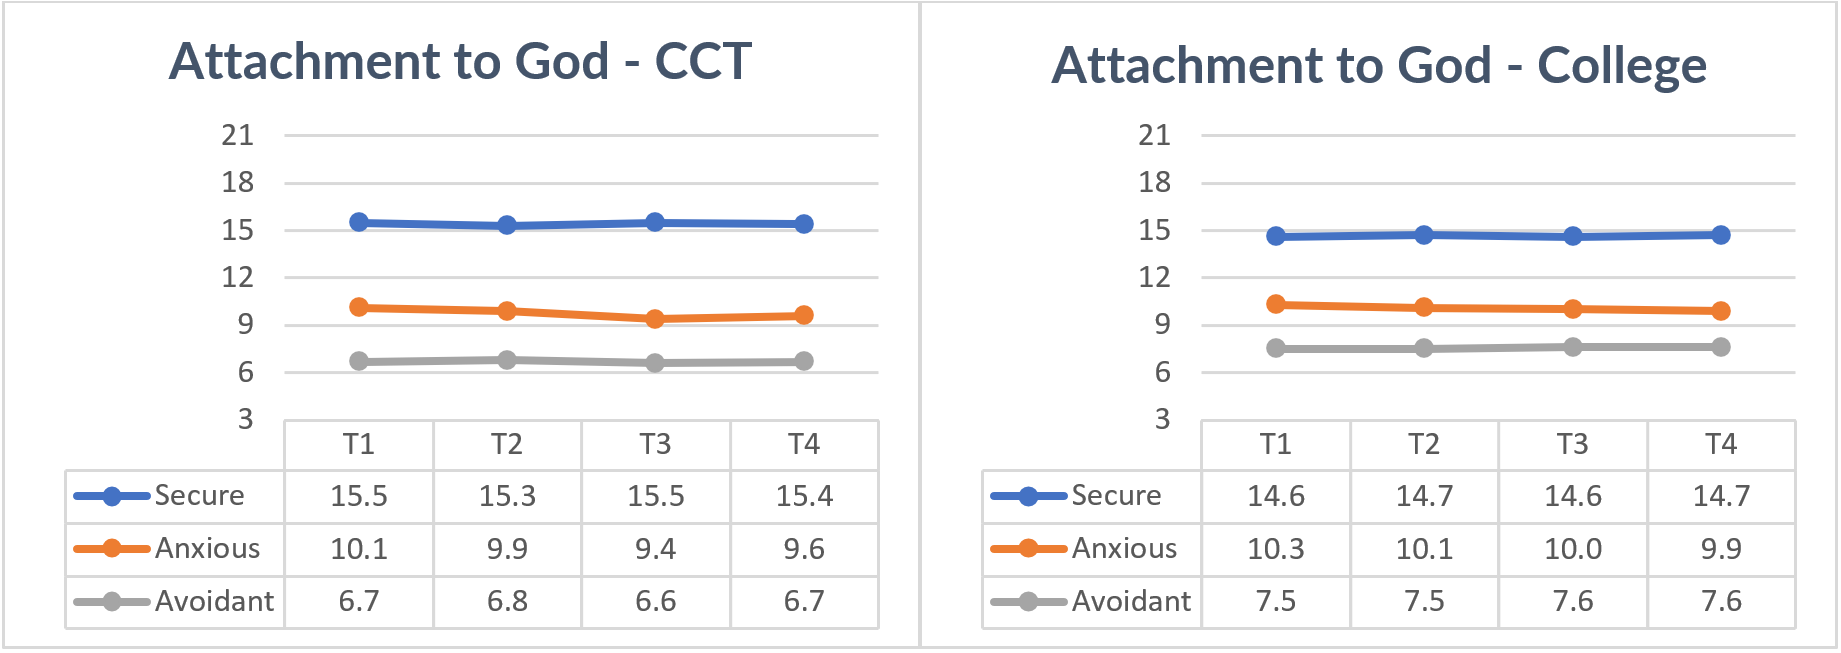
Note. Scale from 1 (not at all characteristic of me) to 7 (very characteristic of me). Max score of 21, minimum of 3.
This study conceptualizes attachment to God according to classic attachment style theory, which suggests that relational attachment styles include secure, anxious, and avoidant attachment. We assessed attachment to God using three subscales from the Attachment to God Scale (Rowatt & Kirkpatrick, 2002). Participants rated their level of agreement with 9 items with responses ranging from 1 (not at all characteristic of me) to 7 (very characteristic of me). Each subscale score (e.g., secure, avoidant, and anxious attachment) was created by summing scores for 3 items, so subscale scores range from 3 to 21.
Secure Attachment to God characterizes a warm, supportive, responsive relationship with God (e.g., “God knows when I need support”).
Interpretation: Across the four timepoints, the CCT students’ secure attachment to God remained relatively stable. As the figure above demonstrates, the CCT sample means ranged from 15.3 to 15.5; the College sample means ranged from 14.6 to 14.7. The range of means among the different centers and institutes is not demonstrated in the figure. Within the CCT sample, the lowest center/institute mean was 13.3, and the highest center/institute mean was 16.5. Overall, for secure attachment to God, these findings suggest the CCT sample (n = 543) is considered average at all timepoints compared to the general College sample (n = 2,243).
Anxious Attachment to God is characterized by an inconsistent relationship with God in which participants are unsure about whether God will be responsive or warm (e.g., “God’s reactions to me seem to be inconsistent”).
Interpretation: Across the four timepoints, the CCT students’ anxious attachment to God decreased slightly. As the figure above demonstrates, the CCT sample means ranged from 9.4 to 10.1; the College sample means ranged from 9.9 to 10.3. The range of means among the different centers and institutes is not demonstrated in the figure. Within the CCT sample, the lowest center/institute mean was 8.3, and the highest center/institute mean was 11.0. Overall, for anxious attachment to God, these findings suggest the CCT sample (n = 543) is considered average at all timepoints compared to the general College sample (n = 2,243).
Avoidant Attachment to God is characterized by participant perceptions that God is impersonal and uninterested (e.g., “God seems impersonal to me”).
Interpretation: Across the four timepoints, the CCT students’ avoidant attachment to God remained relatively stable. As the figure above demonstrates, the CCT sample means ranged from 6.6 to 6.8; the College sample means ranged from 7.5 to 7.6. The range of means among the different centers and institutes is not demonstrated in the figure. Within the CCT sample, the lowest center/institute mean was 5.1, and the highest center/institute mean was 9.6. Overall, for avoidant attachment to God, these findings suggest that the CCT sample (n = 543) is considered average at all timepoints compared to the general College sample (n = 2,243).
- Due to a ceiling effect in the data, we cannot meaningfully interpret low, average, and high for this variable. More specifically, because so many participants in our samples scored high on Christian orthodoxy, the threshold for a “high” score is 7. Remember that the cutoff ranges are relatively arbitrary, so they will be more or less useful depending on the religious or virtue variable measured. ↵
