Survey Results
6 Virtues
This section summarizes the results from the virtue measures—Humility, Generosity, Gratitude, Patience, Self-Control, Courage, and Purpose. For each virtue, we provide an interpretation of low, average, or high. These interpretations are based on cutoff values of the 25th (low), 50th (average), and 75th (high) percentiles of the average virtue scores of students across four timepoints based on our samples of students in CCTs and the general college sample. For more information on cutoff values, see Ch 11 in Cultivating Character: A Toolkit for Assessing Virtues in College Students.
Special Note on Interpretations
The terms “low, average, or high” are used to help interpret your score. These terms do not suggest that your overall score is low, average, or high. The terms are simply a system for meaning making, which is done by comparing your scores to other samples (i.e., CCT and College). For example, if we say the CCT sample was low compared to the College sample, then this suggests that 75% of the College sample scored higher than the CCT sample. Whereas, if we say the CCT sample was high compared to the College sample, then this suggests that at least 75% of the College sample scored lower than the CCT average. If we say the CCT sample was average compared to the College sample, then this suggests the CCT score falls within the middle 50% of College scores (i.e., about 25% of scores fall below and about 25% fall above).
Humility
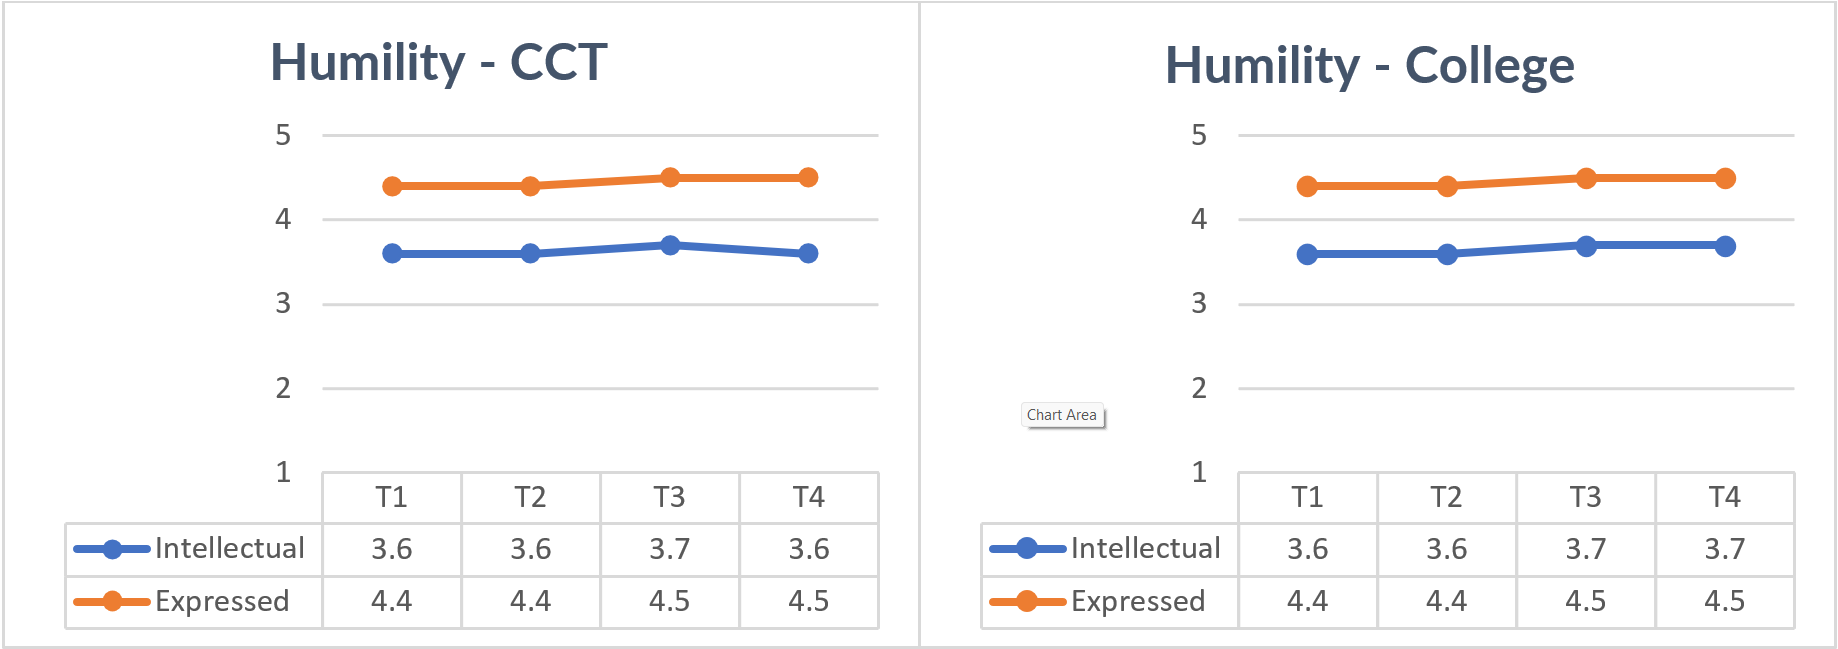
Note. Scale from 1 (not at all true or characteristic of me/strongly disagree) to 5 (extremely true or characteristic of me/strongly agree).
This study measured humility using scales related to intellectual humility and expressed humility (teachability).
Intellectual humility is defined as “recognizing that a particular personal belief may be fallible, accompanied by an appropriate attentiveness to limitations in the evidentiary basis of that belief and to one’s own limitations in obtaining and evaluating relevant information” (Leary et al., 2017). Intellectual Humility was measured using 6 items from the Intellectual Humility Scale (Leary et al., 2017). Response scale include 1 (Not at all true or characteristic of me) to 5 (Extremely true or characteristic of me).
Interpretation: Across the four timepoints, the CCT students’ intellectual humility remained relatively stable. As the figure above demonstrates, the CCT sample means ranged from 3.6 to 3.7; the College sample means ranged from 3.6 to 3.7. The range of means among the different centers and institutes is not demonstrated in the figure. Within the CCT sample, the lowest center/institute mean was 3.3, and the highest center/institute mean was 4.1. Overall, for intellectual humility, these findings suggest that the CCT sample (n = 368) is considered average at all timepoints compared to the general College sample (n = 1,953).
Expressed Humility is defined “as an interpersonal characteristic that emerges in social contexts that connotes (a) a manifested willingness to view oneself accurately, (b) a displayed appreciation of others’ strengths and contributions, and (c) teachability.” (Owens et al., 2013). Expressed Humility was measured using a 3-item subscale of Teachability from the Expressed Humility Scale (Owens et al., 2013). Teachability is defined as “openness to learning, feedback, and new ideas from others” (Owens et al., 2013). Response scale included 1 (Strongly Disagree) to 5 (Strongly Agree).
Interpretation: Across the four timepoints, the CCT students’ expressed humility remained relatively stable. As the figure above demonstrates, the CCT sample means ranged from 4.4 to 4.5; the College sample means ranged from 4.4 to 4.5. The range of means among the different centers and institutes is not demonstrated in the figure. Within the CCT sample, the lowest center/institute mean was 4.3, and the highest center/institute mean was 4.6. Overall, for expressed humility, these findings suggest that the CCT sample (n = 370) is considered average at all timepoints compared to the general College sample (n = 1,955).
Generosity
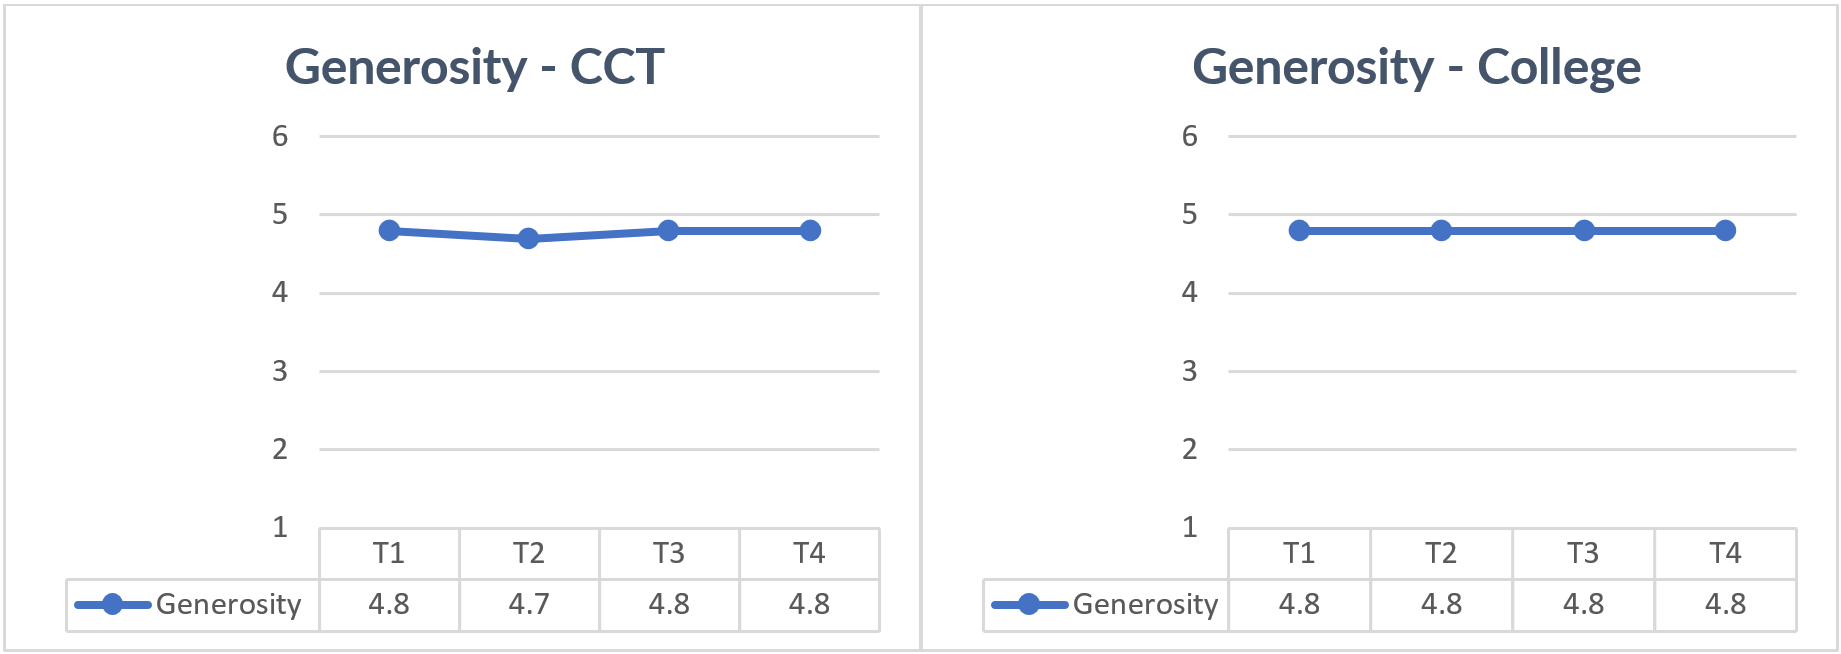
Note. Scale from 1 (strongly disagree) to 6 (strongly agree).
In this study, generosity was measured using the Interpersonal Generosity Scale (Smith & Hill, 2009), which defines generosity as the expenditure of the self for the good of others (Smith & Hill, 2009). Interpersonal generosity is a measure of expressed behavior within social relationships (i.e., this is not merely a disposition). Interpersonal generosity requires that what is given be personal goods like “attention, emotions, and energy,” not mere extrinsic or objectifiable goods like “money, labor, or even blood.” Notably, interpersonal generosity need not be purely altruistic, as expectations of reciprocity/mutuality are common in sincere social relationships. Generosity was measured using 10 items from the Interpersonal Generosity Scale (Smith & Hill, 2009). Response scale include 1 (Strongly disagree) to 6 (Strongly agree).
Interpretation: Across the four timepoints, the CCT students’ interpersonal generosity remained relatively stable. As the figure above demonstrates, the CCT sample means ranged from 4.7 to 4.8; the College sample means remained stable at 4.8. The range of means among the different centers and institutes is not demonstrated in the figure. Within the CCT sample, the lowest center/institute mean was 4.5, and the highest center/institute mean was 5.1. Overall, for interpersonal generosity, these findings suggest that the CCT sample (n = 369) is considered average at all timepoints compared to the general College sample (n = 1,953).
Gratitude
“It is generally accepted that gratitude is both a disposition (being grateful) and a state (feeling grateful)” (Nelson et al., 2022). In this study, gratitude was measured using three scales related to the constructs of gratitude, gratitude to God, and indebtedness to God.
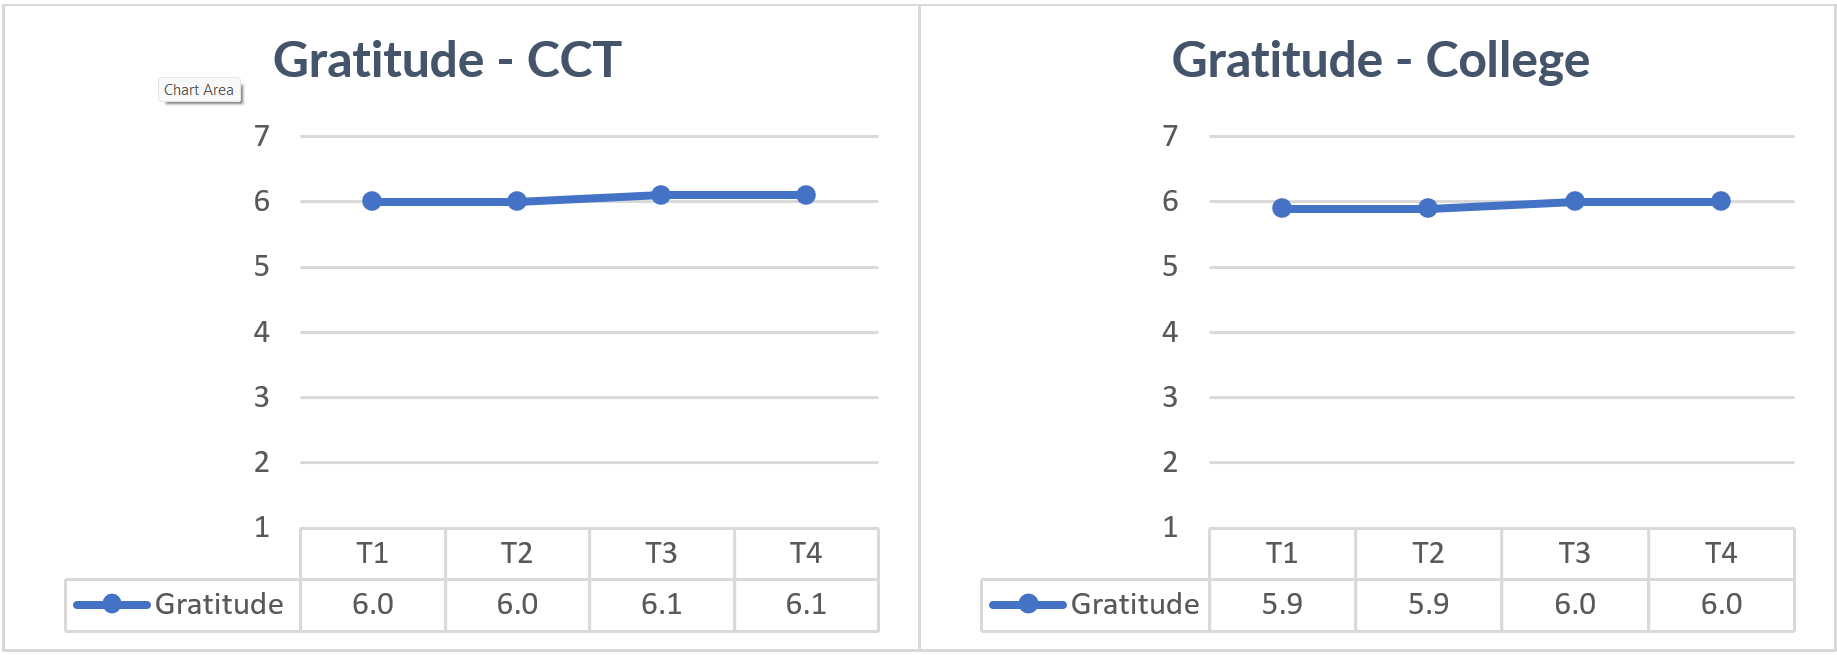 Note. Scale from 1 (strongly disagree) to 7 (strongly agree).
Gratitude is defined as “the appreciation felt after one has been the beneficiary of an altruistic act” (McCullough et al., 2004, pp. 56-57). Gratitude was measured using 6 items from the Gratitude Scale (McCullough et al., 2004). Response options include 1 (Strongly Disagree) to 7 (Strongly Agree).
Interpretation: Across the four timepoints, the CCT students’ gratitude increased slightly. As the figure above demonstrates, the CCT sample means ranged from 6.0 to 6.1; the College sample means ranged from 5.9 to 6.0. The range of means among the different centers and institutes is not demonstrated in the figure. Within the CCT sample, the lowest center/institute mean was 5.7, and the highest center/institute mean was 6.4. Overall, for gratitude, these findings suggest that the CCT sample (n = 368) is considered average at all timepoints compared to the general College sample (n = 1,950).
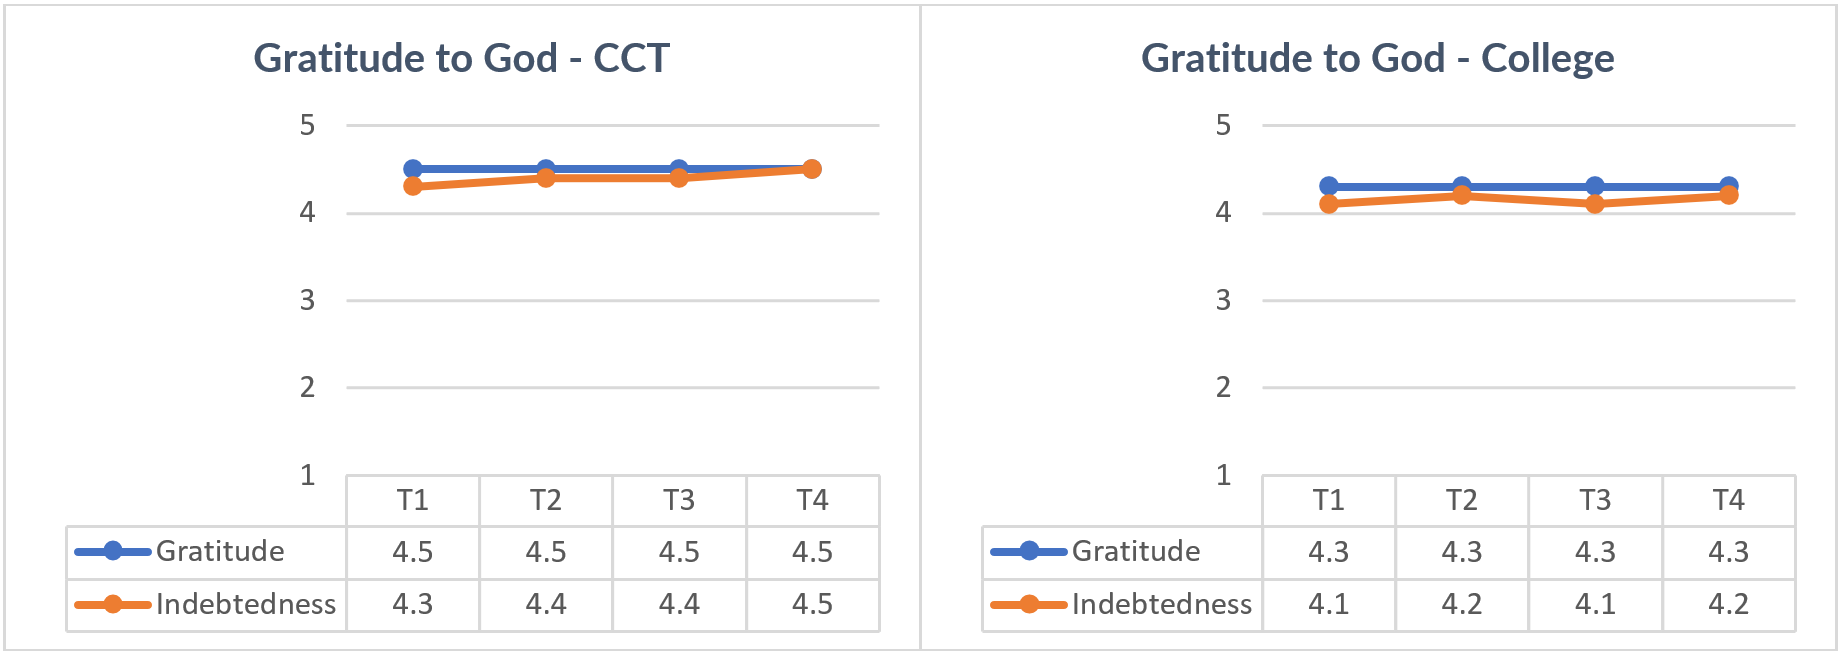
Note. Scale from 1 (strongly disagree) to 5 (strongly agree).
Gratitude toward God is defined as prepositional gratitude directed toward God for a particular benefit/gift (Nelson et al., 2022). Prepositional gratitude is being “grateful to someone for something—a triadic relation between benefactor, beneficiary, and a benefit” (Nelson et al., 2022). Gratitude toward God was measured using 6 items from the Gratitude toward God Scale (Watkins). Response options include 1 (Strongly Disagree) to 5 (Strongly Agree).
Interpretation: Across the four timepoints, the CCT students’ gratitude toward God remained stable. As the figure above demonstrates, the CCT sample means remained stable at 4.5; the College sample means remained stable at 4.3. The range of means among the different centers and institutes is not demonstrated in the figure. Within the CCT sample, the lowest center/institute mean was 4.2, and the highest center/institute mean was 4.7. Overall, for gratitude to God, these findings suggest that the CCT sample (n = 342) is considered average at all timepoints compared to the general College sample (n = 1,711).
Indebtedness to God is defined as “transcendent indebtedness to God as gladly accepted indebtedness to God. Such glad indebtedness to God exists when (a) a benefactor (God) is viewed as beneficent, (b) the benefit is viewed as a gift, (c) the beneficiary experiences mainly positive affect such as love and increased gratitude, (d) the indebtedness improves the relationship of the benefactor and beneficiary, which (e) leads the beneficiary to acknowledge that they can never repay God, yet they desire to express their gratitude in token.” (Nelson et al., 2022). Indebtedness to God was measured using 6 items from the Transcendent Indebtedness to God scale (Nelson et al., 2022). Response options include 1 (Strongly Disagree) to 5 (Strongly Agree).
Interpretation: Across the four timepoints, the CCT students’ indebtedness to God increased. As the figure above demonstrates, the CCT sample means ranged from 4.3 to 4.5; the College sample means ranged from 4.1 to 4.2. The range of means among the different centers and institutes is not demonstrated in the figure. Within the CCT sample, the lowest center/institute mean was 3.9, and the highest center/institute mean was 4.7. Overall, for indebtedness to God, these findings suggest that the CCT sample (n = 341) is considered average at all timepoints compared to the general College sample (n = 1,714).
Patience

Note. Scale from 1 (not like me at all) to 5 (very much like me).
This study defines patience as “the propensity of a person to wait calmly in the face of frustration, adversity, or suffering” (Schnitker, 2012). Patience was measured using 11-items of the 3-Factor Patience scale (Schnitker, 2012). The three factors included selected items from: Interpersonal Patience (5-items), Life Hardship Patience (3-items), and Daily Hassles Patience (3-items). Response options include 1 (Not like me at all) to 5 (Very much like me).
Interpersonal Patience is defined as patience with others (e.g., “When someone is having difficulty learning something new, I will be able to help them without getting frustrated or annoyed”).
Interpretation: Across the four timepoints, your students’ interpersonal patience remained stable. As the figure above demonstrates, the CCT sample means remained stable at 3.6; the College sample means ranged from 3.5 to 3.6. The range of means among the different centers and institutes is not demonstrated in the figure. Within the CCT sample, the lowest center/institute mean was 3.5, and the highest center/institute mean was 3.7. Overall, for interpersonal patience, these findings suggest that the CCT sample (n = 369) is considered average at all timepoints compared to the general College sample (n = 1,946).
Life Hardship Patience is defined as patience through major/significant struggles (e.g., “I am able to wait-out tough times”).
Interpretation: Across the four timepoints, the CCT students’ life hardship patience remained relatively stable. As the figure above demonstrates, the CCT sample means ranged from 3.3 to 3.4; the College sample means ranged from 3.3 to 3.4. The range of means among the different centers and institutes is not demonstrated in the figure. Within the CCT sample, the lowest center/institute mean was 3.1, and the highest center/institute mean was 3.6. Overall, for life hardships patience these findings suggest that the CCT sample (n = 369) is considered average at all timepoints compared to the general College sample (n = 1,946).
Daily Hassle Patience is defined as patience during minor inconveniences (e.g., “Although they’re annoying, I don’t get too upset when stuck in a traffic jam”).
Interpretation: Across the four timepoints, the CCT students’ daily hassle patience remained relatively stable. As the figure above demonstrates, the CCT sample means ranged from 3.5 to 3.6; the College sample means ranged from 3.4 to 3.6. The range of means among the different centers and institutes is not demonstrated in the figure. Within the CCT sample, the lowest center/institute mean was 3.1, and the highest center/institute mean was 3.9. Overall, for daily hassle patience, these findings suggest that the CCT sample (n = 369) is considered average at all timepoints compared to the general College sample (n = 1,946).
Self-Control

Note. Scale from 1 (not at all like me) to 5 (very much like me).
In this study, self-control is defined as “a capacity to change and adapt the self so as to produce a better, more optimal fit between self and world (e.g., Rothbaum et al., 1982). Central to our concept of self-control is the ability to override or change one’s inner responses, as well as to interrupt undesired behavioral tendencies and refrain from acting on them” (Tangney et al., 2004). Self-control was measured using 13-items of the Brief Self-Control scale (Tangney et al., 2004). The scale includes global self-control (all 13-items), and two sub-scales—Inhibitory self-control (6-items), and Initiatory self-control (4-items). Response options include 1 (Not at all like me) to 5 (Very much like me).
Global Self-Control is defined as “a capacity to change and adapt the self so as to produce a better, more optimal fit between self and world (e.g., Rothbaum et al., 1982).
Interpretation: Across the four timepoints, the CCT students’ global self-control increased slightly. As the figure above demonstrates, the CCT sample means ranged from 3.1 to 3.2; the College sample means remained stable at 3.1. The range of means among the different centers and institutes is not demonstrated in the figure. Within the CCT sample, the lowest center/institute mean was 3.0, and the highest center/institute mean was 3.3. Overall, for global self-control, these findings suggest that the CCT sample (n = 371) is considered average at all timepoints compared to the general College sample (n = 1,954).
Inhibitory Self-Control is defined as the “inhibition of immediate impulses” (de Ridder et al., 2011).
Interpretation: Across the four timepoints, the CCT students’ inhibitory self-control increased slightly. As the figure above demonstrates, the CCT sample means ranged from 3.0 to 3.1; the College sample means remained stable at 3.0. The range of means among the different centers and institutes is not demonstrated in the figure. Within the CCT sample, the lowest center/institute mean was 2.8, and the highest center/institute mean was 3.3. Overall, for inhibitory self-control, these findings suggest that the CCT sample (n = 371) is considered average at all timepoints compared to the general College sample (n = 1,954).
Initiatory Self-Control is defined as the “initiation of goal-directed behavior” (de Ridder et al., 2011).
Interpretation: Across the four timepoints, the CCT students’ initiatory self-control increased slightly. As the figure above demonstrates, the CCT sample means remained stable at 3.5; the College sample means remained stable at 3.4. The range of means among the different centers and institutes is not demonstrated in the figure. Within the CCT sample, the lowest center/institute mean was 3.4, and the highest center/institute mean was 3.7. Overall, for initiatory self-control, these findings suggest that the CCT sample (n = 371) is considered average at all timepoints compared to the general College sample (n = 1,954).
Courage
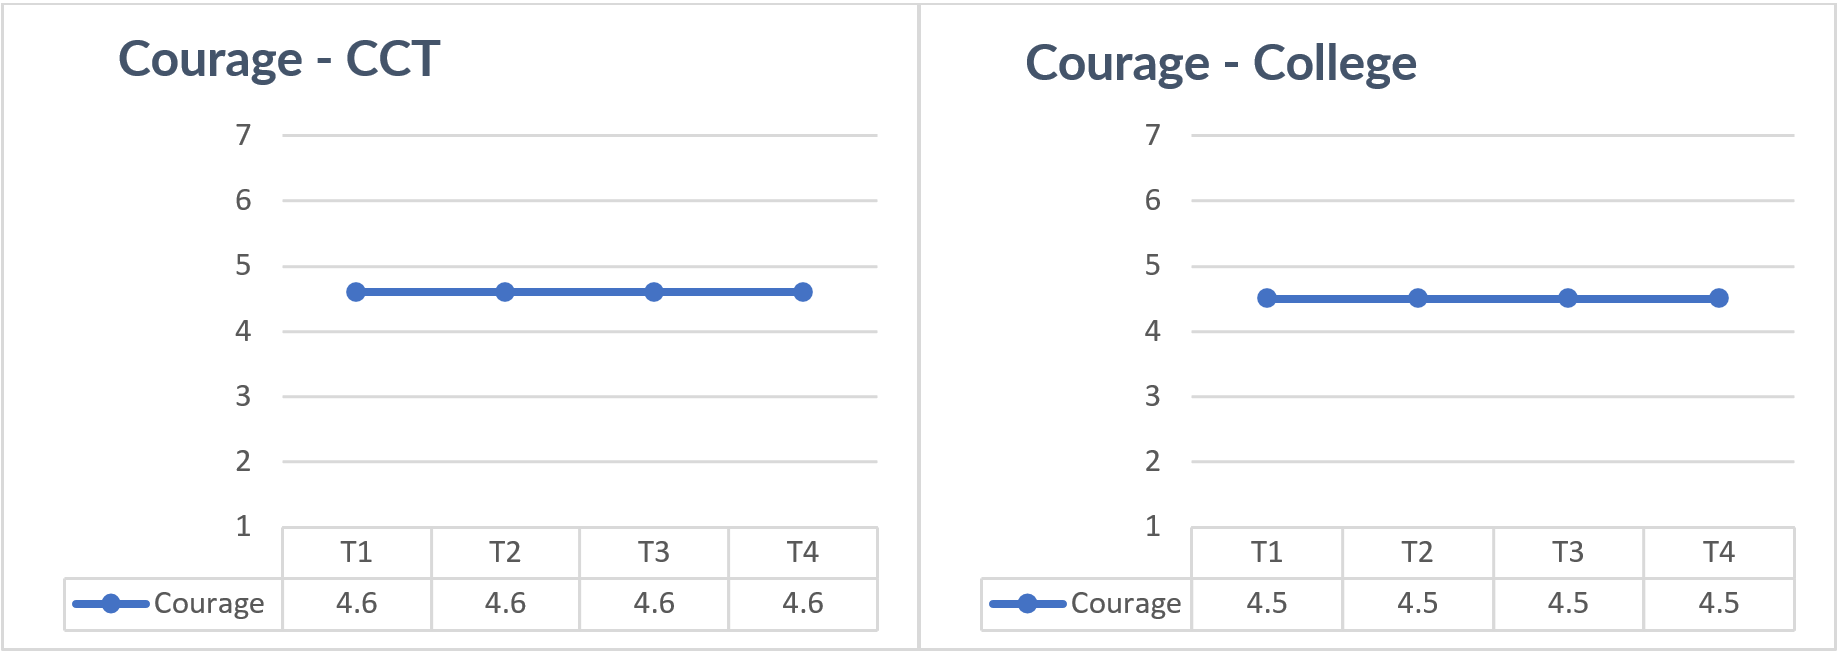
Note. Scale from 1 (never) to 7 (always).
In this study, courage is defined as risk-taking with prosocial motivation (Howard & Alipour, 2014, p. 456). This definition is based on the conceptualization that courage is “‘(1) a willful, intentional act, (2) executed after mindful deliberation, (3) involving objective substantial risk to the actor, (4) primarily motivated to bring about a noble good or worthy end’ (Rate et al., 2007, p. 95)” (Howard & Alipour, 2014, p. 450). Courage was measured using 6-items of the Courage scale (Howard & Alipour, 2014). Response options include 1 (Never) to 7 (Always).
Interpretation: Across the four timepoints, the CCT students’ courage remained stable. As the figure above demonstrates, the CCT sample means remained stable at 4.6; the College sample means remained stable at 4.5. The range of means among the different centers and institutes is not demonstrated in the figure. Within the CCT sample, the lowest center/institute mean was 4.4, and the highest center/institute mean was 4.9. Overall, for courage, these findings suggest that the CCT sample (n = 370) is considered average at all timepoints compared to the general College sample (n = 1,952).
Purpose
“Purpose is a long-term, forward-looking intention to accomplish aims that are meaningful to the self and of consequence to the broader world (Damon, Menon, & Bronk, 2003)” (Bronk et al., 2018, p. 102). In this study, purpose was measured using scales related to meaning in life and beyond the self.

Note. Scale from 1 (strongly disagree) to 7 (strongly agree).
Meaning in Life is a complex construct that is made up of three components: coherence, purpose, and mattering (Costin & Vignoles, 2020). Meaning in life was measured using 16 items from the Multidimensional Meaning in Life Scale (Costin & Vignoles, 2020). There were four subscales—Meaning in Life (4-items), Coherence (4-items), Purpose (4-items), and Mattering (4-items). Response options include 1 (Strongly disagree) to 7 (Strongly agree).
Interpretation: Across the four timepoints, the CCT students’ sense of meaning in life remained stable. As the figure above demonstrates, the CCT sample means remained stable at 6.1; the College sample means ranged from 5.9 to 6.0. The range of means among the different centers and institutes is not demonstrated in the figure. Within the CCT sample, the lowest center/institute mean was 5.6, and the highest center/institute mean was 6.5. Overall, for meaning in life, these findings suggest that the CCT sample (n = 376) is considered average at all timepoints compared to the general College sample (n = 1,975).
Coherence is defined as “the feeling of ‘making sense of one’s experiences in life’ (Reker & Wong, 1988, p. 220).” (Costin & Vignoles, 2020, p. 865).
Interpretation: Across the four timepoints, the CCT students’ sense of coherence increased slightly. As the figure above demonstrates, the CCT sample means ranged from 5.0 to 5.2; the College sample means ranged from 4.9 to 5.0. The range of means among the different centers and institutes is not demonstrated in the figure. Within the CCT sample, the lowest center/institute mean was 4.9, and the highest center/institute mean was 5.3. Overall, for coherence, these findings suggest that the CCT sample (n = 376) is considered average at all timepoints compared to the general College sample (n = 1,975).
Purpose is defined as “the feeling of having a life aim and working toward fulfilling it. Because purpose is predominantly prescriptive and future-oriented, having a sense of purpose may be the feeling that one has a vision of how life should be.” (Costin & Vignoles, 2020, p. 865).
Interpretation: Across the four timepoints, the CCT students’ sense of purpose remained stable. As the figure above demonstrates, the CCT sample means remained stable at 5.5; the College sample means remained stable at 5.4. The range of means among the different centers and institutes is not demonstrated in the figure. Within the CCT sample, the lowest center/institute mean was 5.2, and the highest center/institute mean was 5.8. Overall, for purpose, these findings suggest that the CCT sample (n = 376) is considered average at all timepoints compared to the general College sample (n = 1,975).
Mattering is defined as the feeling “that one’s actions make a difference in the world and that life is worth living (George & Park, 2016; Martela & Steger, 2016)” (Costin & Vignoles, 2020, p. 865).
Interpretation: Across the four timepoints, the CCT students’ sense of mattering remained relatively stable. As the figure above demonstrates, the CCT sample means ranged from 5.5 to 5.6; the College sample means remained stable at 5.3. The range of means among the different centers and institutes is not demonstrated in the figure. Within the CCT sample, the lowest center/institute mean was 5.1, and the highest center/institute mean was 6.0. Overall, for mattering, these findings suggest that the CCT sample (n = 376) is considered average at all timepoints compared to the general College sample (n = 1,975).
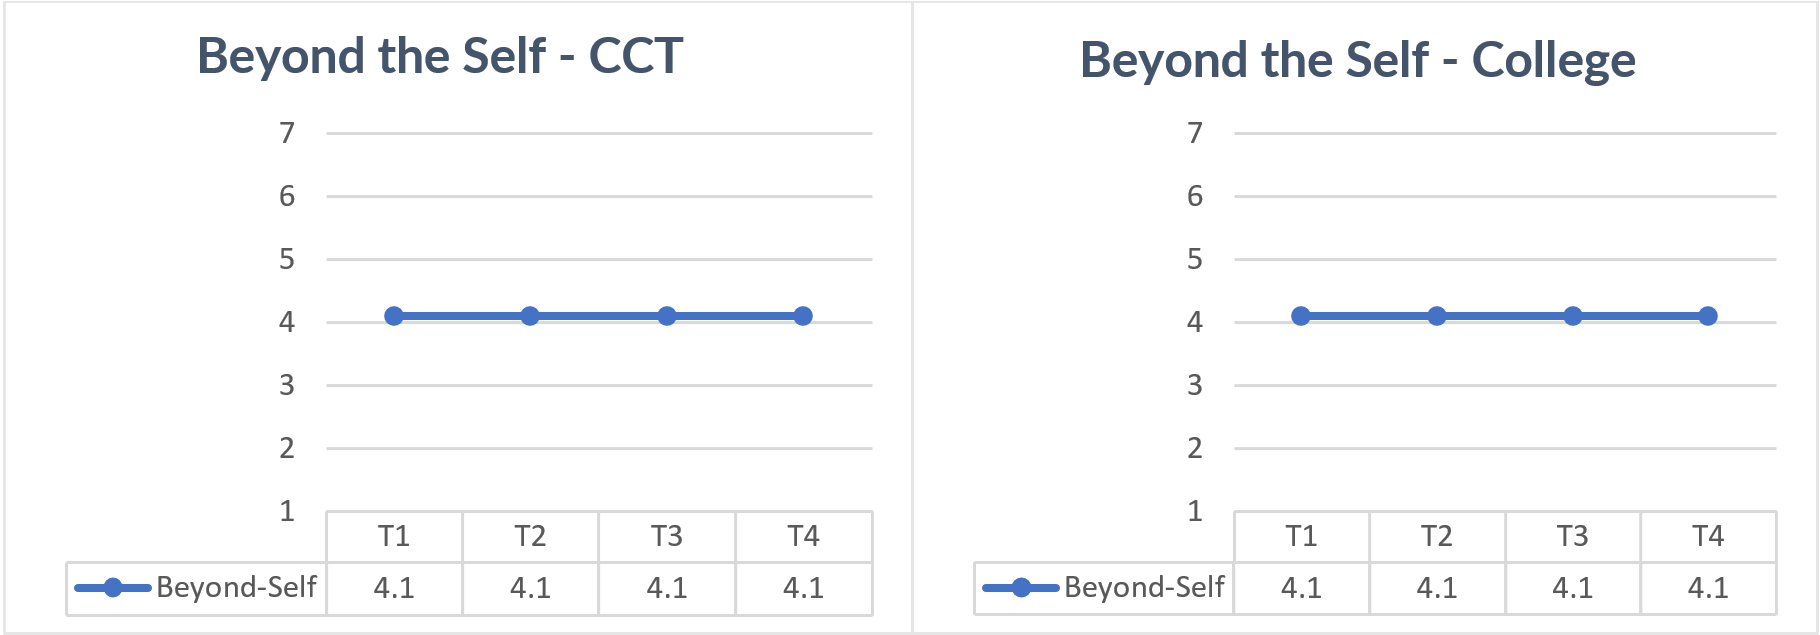
Note. Scale from 1 (almost never) to 7 (almost all the time).
Beyond-the-self purpose is “inspired, at least in part, by a desire to make a difference in the ‘broader world’” (Bronk et al., 2018, p. 102). Although most examples of purpose are moral, beyond-the-self purpose is not necessarily moral. Indeed, people can be strongly motivated by a purpose beyond themselves to do bad things (e.g., World Trade Center airplane hijackers) (Bronk et al., 2018). Beyond the self was measured using 4 items from the Claremont Purpose Scale Beyond-the-Self Orientation (Bronk et al., 2018). Response options include 1 (Almost never) to 7 (Almost all the time).
Interpretation: Across the four timepoints, the CCT students’ beyond-the-self orientation remained stable. As the figure above demonstrates, the CCT sample means remained stable at 4.1; the College sample means remained stable at 4.1. The range of means among the different centers and institutes is not demonstrated in the figure. Within the CCT sample, the lowest center/institute mean was 3.8, and the highest center/institute mean was 4.4. Overall, for beyond-the-self, these findings suggest the CCT sample (n = 376) is considered average at all timepoints compared to the general College sample (n = 1,975).
