Solution
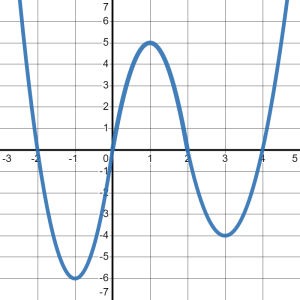
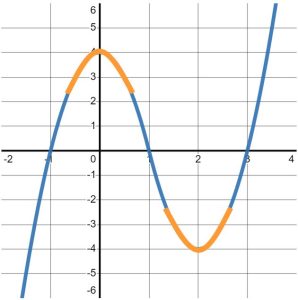
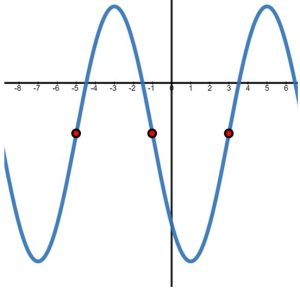
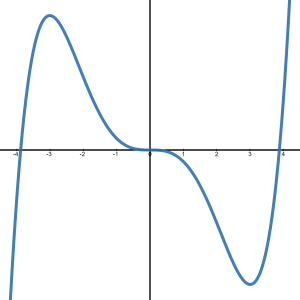
The key for questions like this is to focus on the SLOPES of the graph, NOT the [latex]y-[/latex]values of the graph. Then, we will write down what we observe as we read the graph from left to right. For example, when I trace the graph with my finger from the bottom-left corner, I immediately begin to move UP and to the right, as seen in Figure 2.
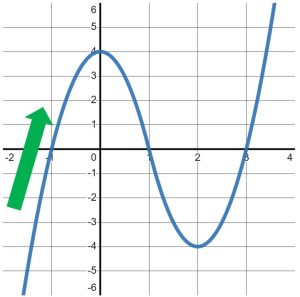
Figure 2
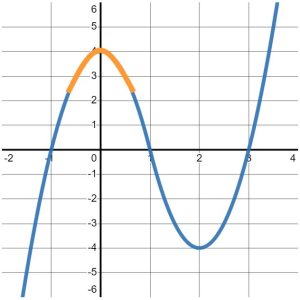
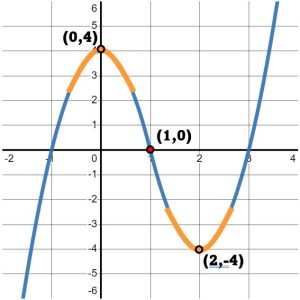
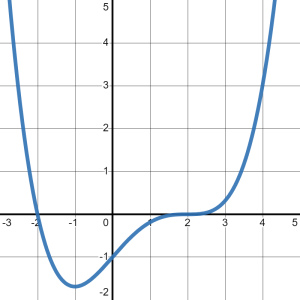
When does the graph stop moving up? It stops moving up precisely at the point where it changes direction again. Note that after the point [latex]\left(0,4\right)[/latex], the graph begins to move DOWN, as in Figure 3.
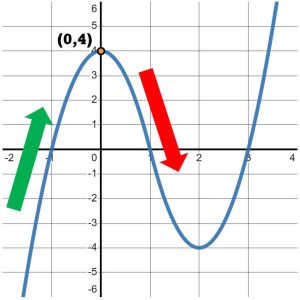
Figure 3
So, we can definitely say that this graph increases from where it starts to the point [latex]\left(0,4\right)[/latex]. We write that with respect to the [latex]x-[/latex]values of this interval. Since the problem did not specify a starting value, we will assume this graph starts on the far-left of the number line, that is at [latex]-\infty[/latex]. This first interval of increasing ends when the [latex]x-[/latex]value is [latex]0[/latex]. So, we write the interval of increasing as:
[latex]\left(-\infty,0\right)[/latex].
Note that we used soft parentheses for this interval - not hard brackets. That is because NEITHER [latex]-\infty[/latex] nor [latex]0[/latex] are included in the interval.
- The graph cannot be increasing at [latex]x=-\infty[/latex] because [latex]x[/latex] can never equal [latex]-\infty[/latex]. [latex]-\infty[/latex] is not a value.
- The graph cannot be increasing at [latex]x=0[/latex] because that is the point where the graph changes direction. The slope of the graph is not positive at [latex]x=0[/latex].
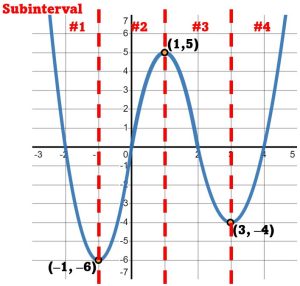
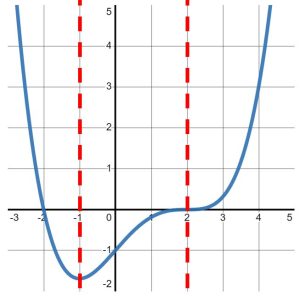
Continuing to trace the graph, we see that it continues down until the point [latex]\left(2,-4\right)[/latex]. After that point, we start tracing up again, as in Figure 4.
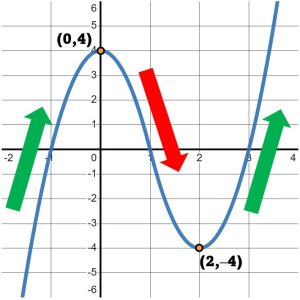
Figure 4
So, we can definitely say that the graph decreases from the point [latex]\left(0,4\right)[/latex] to the point [latex]\left(2,-4\right)[/latex]. As before, we will write that interval of decreasing with respect to the [latex]x-[/latex]values:
[latex]\left(0,2\right)[/latex].
Again, notice that we used soft parentheses for both ends of this interval.
- As the graph was not increasing at the point [latex]\left(0,4\right)[/latex], it is also not decreasing there. [latex]\left(0,4\right)[/latex] is the instance where the graph transitions from increasing to decreasing - or positive slopes to negative slopes.
- Likewise, the graph is not decreasing at [latex]\left(2,-4\right)[/latex]. [latex]\left(2,-4\right)[/latex] is the point where the slope of the graph changes direction again.
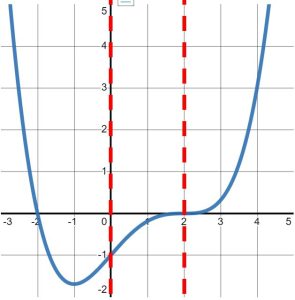
In fact, we observed that after the point [latex]\left(2,-4\right)[/latex], the graph increases. Since we do not see another place where the graph changes direction, we will assume is continues to increases forever, that is to [latex]\infty[/latex]. Therefore, we write our second interval of increasing as:
[latex]\left(2,\infty\right)[/latex].
When we write our complete answer all together, we could denote the fact that there were two intervals of increasing by using the union symbol [latex]\cup[/latex] between them. Thus, our final answer would read:
[latex]\textcolor{blue}{\begin{array}{ll} \text{The graph is increasing on} & \left(-\infty,0\right) \, \cup \, \left(2,\infty\right) \hfill \\ \text{The graph is decreasing on} & \left(0,2\right). \hfill \end{array}}[/latex]
Note that we observed the graph was neither increasing nor decreasing at [latex]\left(0,4\right)[/latex] and [latex]\left(2,-4\right)[/latex]. At these two points, the graph has zero slope. In fact, because the graph increases to [latex]\left(0,4\right)[/latex] and decreases away, we can say that:
the graph has a local maximum at [latex]\left(0,4\right)[/latex].
Similarly, because the graph decreases to [latex]\left(2,-4\right)[/latex] and increases away, we can say that:
the graph has a local minimum at [latex]\left(2,-4\right)[/latex].